
Rad Realty · GTA market brief · September 2026
Fewer listings.
Fewer sales. Lower prices.
New listings fell more than sales. Both price measures also declined, but they describe different things.
Year-over-year decline · magnitude, percent
16,500 new listings
5,040 sales
Composite benchmark, not an average
$1,006,409 average selling price
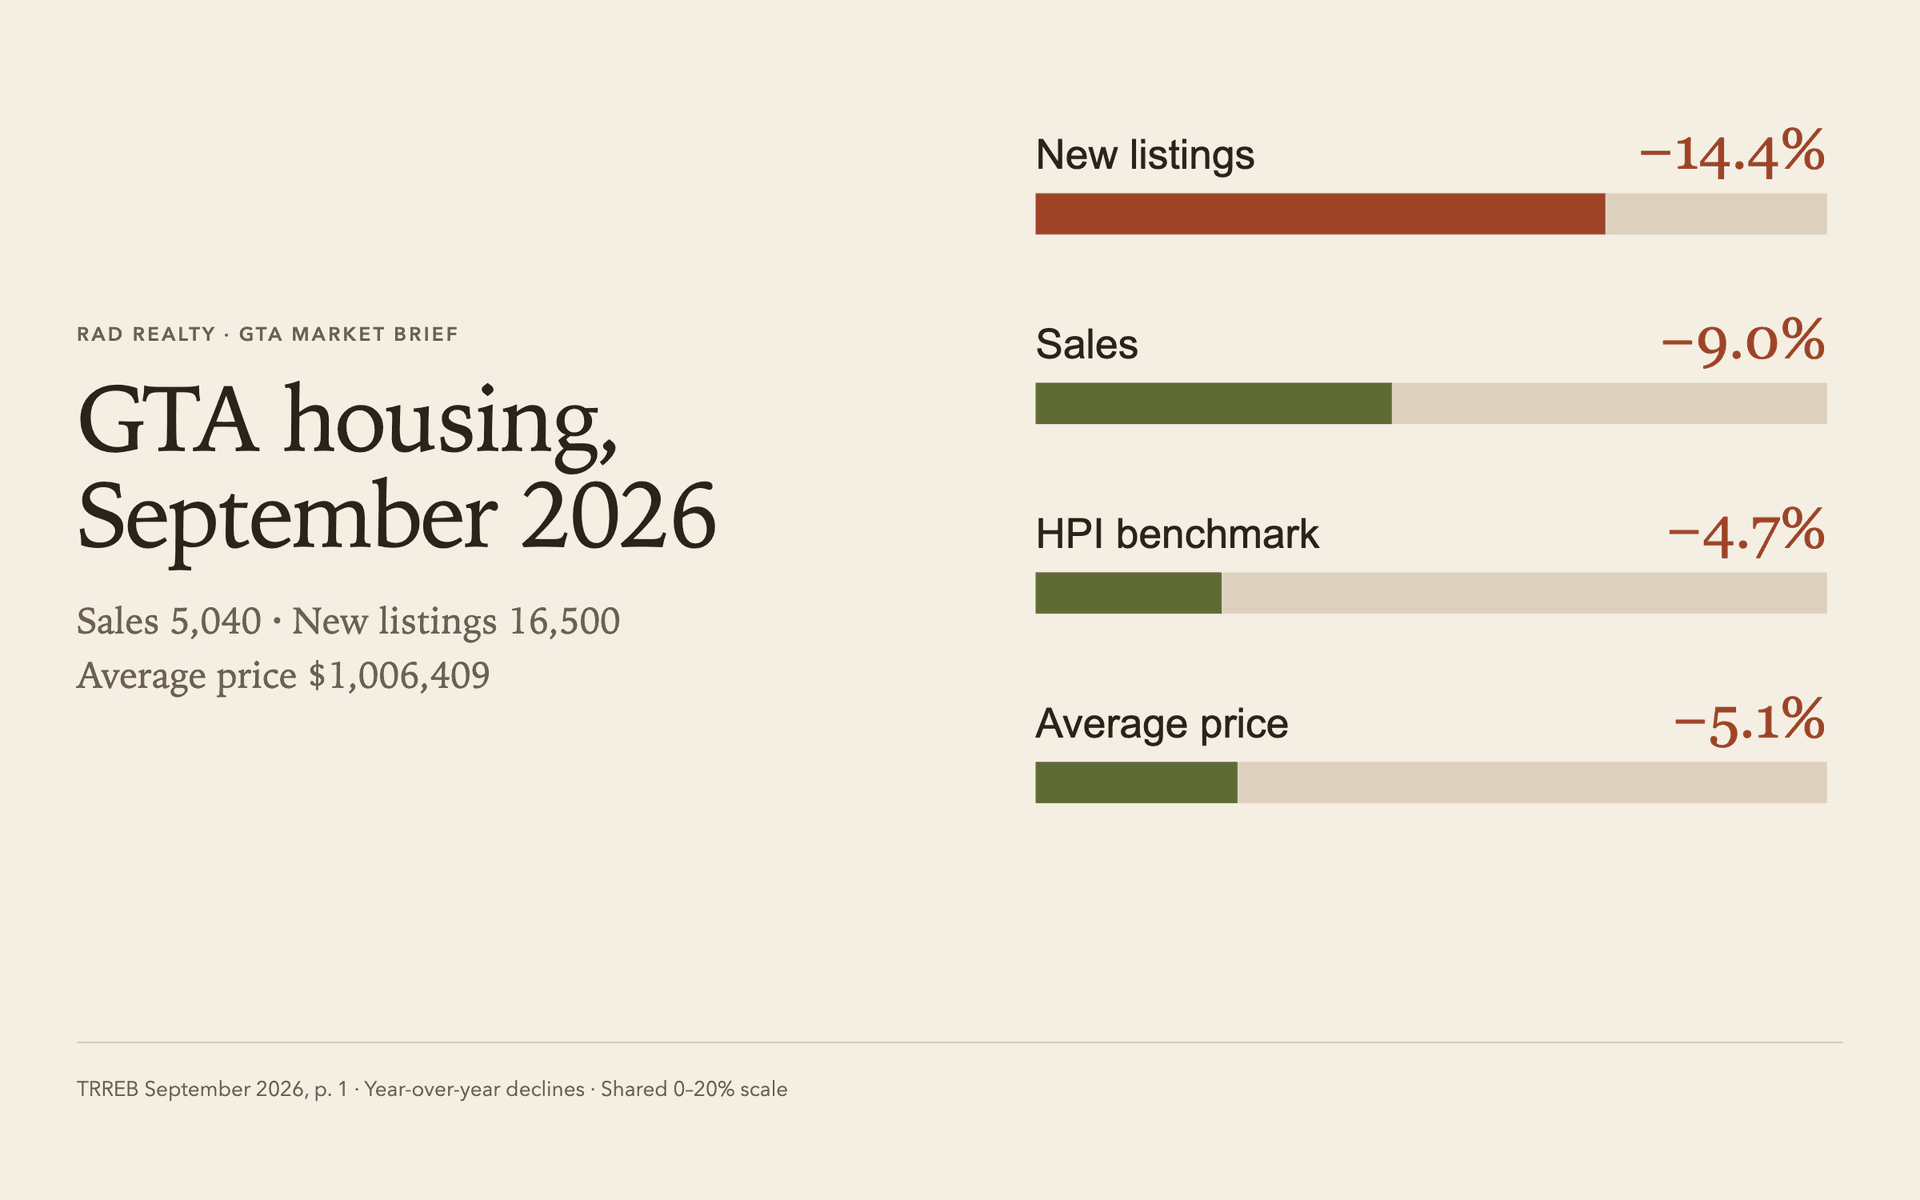
TRREB reported 5,040 GTA home sales in September 2026, down 9.0% from September 2025, while 16,500 new listings were down 14.4%. The GTA MLS® HPI Composite benchmark was down 4.7% year over year, and the GTA average selling price was $1,006,409, down 5.1%. These figures describe the GTA market overall, not a specific Toronto district, property type, building or home.
What changed in the GTA housing market in September 2026?
Sales and new listings were both below September 2025 levels: sales were down 9.0% while new listings were down 14.4%. The GTA MLS® HPI Composite benchmark was down 4.7% year over year, and the average selling price was $1,006,409, down 5.1%. These GTA-wide figures do not describe a specific district or property.
September 2026 at a glance
- GTA home sales: 5,040, down 9.0% from September 2025.
- GTA new listings: 16,500, down 14.4% from September 2025.
- GTA MLS® HPI Composite benchmark: down 4.7% year over year.
- GTA average selling price: $1,006,409, down 5.1% year over year.
GTA sales and new listings
TRREB reported 5,040 GTA home sales and 16,500 new listings in September 2026. The year-over-year measures were down 9.0% for sales and down 14.4% for new listings.
GTA benchmark and average selling price
The GTA MLS® HPI Composite benchmark was down 4.7% year over year. The GTA average selling price was $1,006,409, down 5.1% year over year.
What changed from August and from September 2025
On a seasonally adjusted month-over-month basis, TRREB reported that GTA sales and new listings both decreased from August 2026. Compared with September 2025, sales were down 9.0% and new listings were down 14.4%.
Bank of Canada policy-rate context
The Bank of Canada target for the overnight rate was 2.25% on September 2, 2026. This is the central bank’s policy-rate measure, not a borrowing quote for an individual buyer.
Questions buyers and sellers should verify for a specific property
- Does the cited figure use GTA geography or a narrower geography?
- Does it describe all home types or a specific property type?
- Is the comparison month over month or year over year?
- Is the measure a benchmark, an average, a sales count, or a listings count?
Method, GTA geography and source date
The housing measures above come from the TRREB September 2026 Market Watch release, published October 6, 2026, and are labelled as GTA-wide figures. The policy-rate context comes from the Bank of Canada key interest rate page.
TRREB notes that historic figures can be revised as additional boards join the PropTx system. The comparisons here use the September report’s own year-over-year figures, rather than combining older releases. For subsequent releases, see the TRREB Market Watch page. Sources checked October 16, 2026.
Get Market Updates
Subscribe for Toronto real estate insights and tips.

